National Ag Day: 10 reasons to thank a farmer
The Social Silo just posted a infographic to celebrate National Agriculture Day.
Ohio producing wells as of June 26, 2015 (Infographic)
In Ohio, Carroll County has the most producing wells as of June 26, 2015.
Venison cuts and uses (Infographic)
If you're new to cooking venison, this infographic offers tips for butchering and cooking venison.
National Dairy Month infographic
June is National Dairy Month! Did you know a cow produces enough milk each day to fill 6 one-gallon jugs? Read more fun dairy facts on our infographic!
Infographic: Ohio’s top producing wells as of Sept. 2014
Ohio's top producing shale wells as of Sept. 2014.
From Santa to shopping: The origins of Christmas traditions
The first traces of wrapping paper and decorations arrive in stores as early as September, transforming the holiday into a much more secular celebration than its modest Christian beginnings.
Farm Tragedy by the Numbers (Infographic)
Worker fatalities among workers younger than 16 run higher in agriculture than all non-agricultural industries combined.
Dairy Goats (Infographic)
Everything you wanted to know about dairy goats in the U.S.
October is apple month (Infographic)
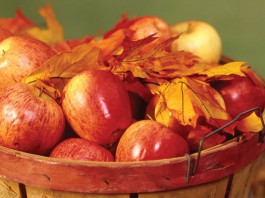
Apples are grown in all 50 states, and there are about 100 varieties of apples grown in the U.S. today.
Pennsylvania’s producing wells as of Jan. 31, 2016
Washington County leads the way with the most producing wells in western Pennsylvania's Marcellus shale.


