Miscues over ‘sell-by dates’ leads to consumer loss (Infographic)
Dates on packages don't always mean what you think.
National Dairy Month infographic
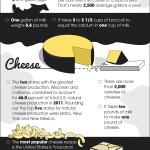
June is National Dairy Month! Did you know a cow produces enough milk each day to fill 6 one-gallon jugs? Read more fun dairy facts on our infographic!
Ohio, Pa. agriculture by the numbers (Infographic)
We often take the economic impact of local agriculture for granted. This infographic breaks down numbers from U.S., Ohio and Pennsylvania agriculture.
Ohio, Holmes County forestry industry infographic
The Holmes County timber and wood products industry generates $421 million in output and $24.7 million in tax revenue. Learn more about this Ohio economic driver in this infographic.
National Ag Day: 10 reasons to thank a farmer
The Social Silo just posted a infographic to celebrate National Agriculture Day.
October is apple month (Infographic)
Apples are grown in all 50 states, and there are about 100 varieties of apples grown in the U.S. today.
2015 is the International Year of Soils (Infographic)
2015 is the 60th anniversary of the National Association of Conservation Districts' Soil and Water Stewardship Week.
July is National Ice Cream Month (Infographic)
July is National Ice Cream Month! To celebrate, Farm and Dairy gathered some of our favorite ice cream facts and placed them in an infographic!
Ohio producing wells as of July 31, 2015 (Infographic)
Carroll County continues to have the largest number of producing wells in the state.
Infographic: Shale did you know…
More drilling permits are being issued as oil and gas companies continue to explore the Marcellus and Utica shale plays.


