
")


WASHINGTON — The nation’s poverty rate was 16 percent in 2012, unchanged from 2011.
That’s according to a supplemental poverty measure released by the U.S. Census Bureau.
The 2012 rate was higher than the official measure of 15 percent. The official poverty rate in 2012 was also not significantly different from the corresponding rate in 2011.
What’s the difference?
Unlike the official poverty rate, the supplemental poverty measure takes into account the impact of different benefits and necessary expenses on the resources available to families, as well as geographic differences in housing costs.
For example, the measure adds refundable tax credits (the Earned Income Tax Credit and the refundable portion of the child tax credit) to cash income, which reduces the supplemental poverty rate for all people by three percentage points (19 percent to 16 percent).
Lower disposable income
The supplemental poverty measure deducts various necessary expenses from income; these include medical out-of-pocket expenses, income and payroll taxes, child care expenses and work-related expenses.
These expenses reduce income available for necessary basic goods purchases including food, clothing, shelter and utilities (FCSU) and a small additional amount to allow for other needs.
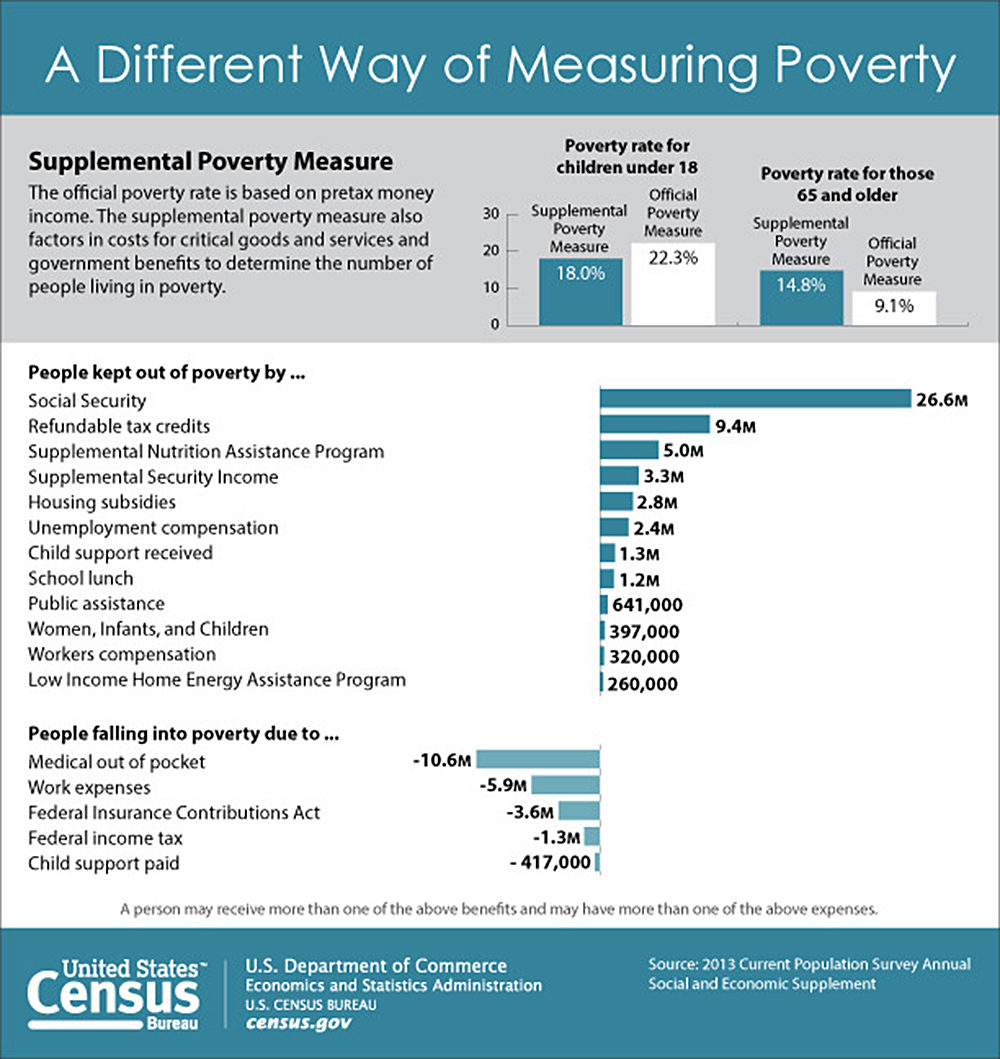
Medical expenses
Deducting medical out-of-pocket expenses increases the supplemental poverty rate by 3.4 percentage points.
Without accounting for medical out-of-pocket expenses, the number of people living below the poverty line would have been 39.2 million rather than the 49.7 million people classified as poor with the supplemental poverty measure.
Without adding Social Security benefits to income, the supplemental poverty rate overall would have been 8.6 percentage points higher (or 24.5 percent rather than 16 percent).
Elderly
People 65 and older had a supplemental poverty rate of 14.8 percent, equating to 6.4 million. Excluding Social Security would leave the majority of this population (54.7 percent or 23.7 million) in poverty.
Geography matters
The supplemental poverty measure’s poverty thresholds vary by geography, family size and whether a family pays a mortgage, rents or owns their home free and clear.
For example, the 2012 thresholds for families with two adults and two children were around $18,000 for homeowners without a mortgage living outside metropolitan areas in North Dakota, Kentucky, West Virginia, Alabama, Arkansas, South Dakota, Tennessee and Missouri, but around $35,500 for homeowners with a mortgage in the San Jose-Sunnyvale-Santa Clara, Calif., and San Francisco-Oakland-Fremont, Calif., metro areas.
The $23,283 official poverty threshold for a family of four was the same no matter where a family lives.
“The important contribution that the supplemental poverty measure provides is allowing us to gauge the effectiveness of tax credits and transfers in alleviating poverty,” said Kathleen Short, a Census Bureau economist and the report’s author.
Comparing rates
The supplemental poverty measure can show the effects of tax and transfer policies on various subgroups, unlike the current official poverty measure.
According to the report:
- Including tax credits and noncash benefits results in lower poverty rates for some groups. For instance, the supplemental poverty rate was lower for children than the official rate: 18 percent compared with 22.3 percent. Subtracting necessary expenses from income results in higher poverty rates for other groups.
- The supplemental poverty rate for those 65 and older was 14.8 percent compared with only 9.1 percent using the official measure. Medical out-of-pocket expenses were a significant element for this group.
- Even though supplemental poverty rates were lower than the official rates for children and higher for those 65 and older, the rates for children were still higher than the rates for both 18- to 64-year-olds and people 65 and older.
- Supplemental poverty rates differed by region primarily because the supplemental poverty rate has thresholds that vary geographically.
- The rates were higher than official rates for the Northeast and West, lower in the Midwest and not statistically different from the official measure in the South. These results reflect differences in housing costs, which are not captured by the official poverty measure.


